With Inferential statistics we can make inferences about the population using the sample data. Now, these methods help us formulate a basic idea or conclusion about the population.
However, you could not confirm the conclusions you made about the population about the data. It is here that hypothesis testing comes into the picture.
But how do you really confirm these conclusions or hypotheses? Lets see in details
What is a Hypothesis?
When we perform an analysis on a population sample — the analysis could be descriptive, inferential, or exploratory in nature — we get certain information from which we can make claims about the entire population. These are just the claims; we can’t be sure if they’re actually true. This kind of claim or assumption is called a hypothesis.
Example: The average price of a 5 room HDB apartment in Singapore is SG $500K.
What is Hypothesis Testing?
There are ways to check if your hypothesis has any truth to it, and if the hypothesis is true then apply it to the population parameters. This is called hypothesis testing. The goal is to determine whether there is enough evidence to infer that the hypothesis about the population parameter is true. In hypothesis testing, we confirm our assumptions about the population based on sample data.
Difference between Inferential Statistics & Hypothesis Testing
Let’s understand the basic difference between inferential statistics and hypothesis testing.
Inferential statistics is used to find some population parameter (mostly population mean) when you have no initial number to start with. So, you start with the sampling activity and find out the sample mean. Then, you estimate the population mean from the sample mean using the confidence interval.
Hypothesis testing is used to confirm your conclusion (or hypothesis) about the population parameter. Through hypothesis testing, you can determine whether there is enough evidence to conclude if the hypothesis about the population parameter is true or not.
- Null hypothesis (H0): The status quo
- Alternate hypothesis (H1): The challenge to the status quo
Let’s get started by understanding the basics of hypothesis testing.
Example:
Suppose an employee has been charged with misconduct.In the criminal trial for this case, the jury has to decide whether the defendant is innocent or guilty. Now, this can be turned into two hypotheses. You can claim that the defendant is innocent, and you can claim that the defendant is not innocent, i.e. guilty.
Therefore, you have two opposing hypotheses about the defendant. These two opposing hypotheses are called the null hypothesis and the alternate hypothesis.
- The null hypothesis is the prevailing belief about a population; it states that there is no change or no difference in the situation. In our criminal trial example, the defendant was considered innocent. So, the null hypothesis claims that he is innocent, just like he was before the murder charge. Null Hypothesis is denoted by H0
- The alternate hypothesis, or research hypothesis as it is also called, is the claim that opposes the null hypothesis. If you were the prosecutor in the trial, your claim would be that the defendant is guilty, and you would try to prove this. So, the alternate hypothesis is an assumption that competes with the null hypothesis. Alternate Hypothesis is denoted by H1.
Outcome of Hypothesis Testing
Suppose, at the end of the trial, the jury reaches a decision. What would be the outcome in terms of hypothesis testing?
If the defendant is found guilty, it means that the jury rejects the null hypothesis in favour of the alternate hypothesis. The jury decides that there is enough evidence to support the alternate hypothesis, and to conclude that the defendant is guilty.
On the other hand, if the jury acquits the defendant, it means that there is not enough evidence to support the alternate hypothesis. Keep in mind that this does not mean that the defendant is innocent, it just means that there is not enough evidence to conclude that he is guilty. In other words, we cannot accept the null hypothesis; we can only fail to reject it.
Therefore, in hypothesis testing, if there is sufficient evidence to support the alternate hypothesis, you reject the null hypothesis; and if there is not sufficient evidence to support the alternate hypothesis, you fail to reject the null hypothesis. So, you should never say that you “accept” the null hypothesis.
Note:You should never say that you “accept” the null hypothesis.
Formulating Null & Alternate Hypotheses
If your claim statement has words like “at least”, “at most”, “less than”, or “greater than”, you cannot formulate the null hypothesis just from the claim statement (because it’s not necessary that the claim is always about the status quo).
You can use the following rule to formulate the null and alternate hypotheses:
- The null hypothesis always has the following signs: = OR ≤ OR ≥
- The alternate hypothesis always has the following signs: ≠OR > OR <
For example:
Reports say that the mean birth weight of babies of Singapore at least 3 KG. We want to perform a significance test to see if this holds true. We took a random sample of babies and observes a mean birthweight of xˉ=2.93 kg.
Here’s our null hypothesis:
H0: The mean birth weight in this nation >= 3KG.
H1 : The mean birth weight in this nation =/ 3KG
To summarize this, you cannot decide the status quo or formulate the null hypotheses from the claim statement, you need to take care of signs in writing the null hypothesis. Null Hypothesis never contains ≠ or > or < signs. It always has to be formulated using ≠or > or < Signs.
Making a Decision
Once you have formulated the null and alternate hypotheses, let’s turn our attention to the most important step of hypothesis testing — making the decision to either reject or fail to reject the null hypothesis.
What is sample Mean?
The sample mean x̄ from a group of observations is an estimate of the population mean . Given a sample of size n, consider n independent random variables X1, X2, …, Xn, each corresponding to one randomly selected observation. Each of these variables has the distribution of the population, with mean μ and standard deviation Σ. The sample mean is defined to be .
x̄ = 1/n * (X1+X2+…+Xn)
By the properties of means and variances of random variables, the mean and variance of the sample mean are the following:
μx̄ = μ
Σx̄ =Σ / Sqt n
Although the mean of the distribution of x̄ is identical to the mean of the population distribution, the variance is much smaller for large sample sizes.
What is Population Mean
The population mean is an average of a group characteristic. The group could be a person, item, or thing,
The formula to find the population mean is:
μ= (Σ* X)/ N
where:
Σmeans “the sum of.”
X = all the individual items in the group.
N = the number of items in the group.
Sample Mean Vs Population Mean
Figuring out the population mean should feel familiar. You’re just taking an average, using the same formula you probably learned in basic math (just with different notation). However, care must be taken to ensure that you are calculating the mean for a population (the whole group) and not a sample (part of the group). The symbols for the two are different:
Population mean symbol = μ
Sample mean symbol = x̄
Making a Decision
Once you have formulated the null and alternate hypotheses, the next most important step of hypothesis testing is — making the decision to either reject or fail to reject the null hypothesis
LCV and UCV (lower critical value and upper critical value) in between LCV and UCV lies the acceptable region.
Let’s learn more about the critical region and understand how the position of the critical region changes with the different types of null and alternate hypotheses.
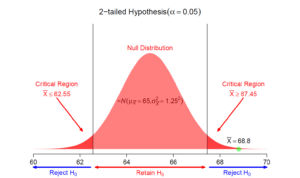
Two tail test:
Two-tailed test is a statistical test in which the critical area of a distribution is two-sided and tests whether a sample is greater than or less than a certain range of values. If the sample being tested falls into either of the critical areas, the alternative hypothesis is accepted instead of the null hypothesis.
Two tail test is consistently used in Pharmaceutical industry.
Directional Hypothesis : One tail test (Lower tail or Upper tail test):
The formulation of the null and alternate hypotheses determines the type of the test and the position of the critical regions in the normal distribution.
You can tell the type of the test and the position of the critical region on the basis of the ‘sign’ in the alternate hypothesis.
≠ in H₁ → Two-tailed test → Rejection region on both sides of distribution
< in H₁ → Lower-tailed test → Rejection region on left side of distribution
> in H₁ → Upper-tailed test → Rejection region on right side of distribution
There are two types of methods to reach the final decision of rejecting or failing to reject the null hypothesis.
Methods to make a Decision
There are below types of methods to reach the final decision of rejecting or failing to reject the null hypothesis.
- Critical Value Method
- P-Value Method
Critical Value Method
Now, let’s learn how to find the critical values for the critical region in the distribution and make the final decision of rejecting or failing to reject the null hypothesis.
After formulating the hypothesis, the steps you have to follow to make a decision using the critical value method are as follows:
- Calculate the value of Zċ from the given value of α(significance level). Take it a 5% if not specified in the problem.
- Calculate the critical values (UCV and LCV) from the value of Zċ.
- Make the decision on the basis of the value of the sample mean x with respect to the critical values (UCV & LCV).
P-Value Method
There are various methods similar to the critical value method to statistically make your decision about the hypothesis. One such method is the p-value method. This is an important method and is used more frequently in the industry.
What is p-value?
The P value, or calculated probability, is the probability of finding the observed, or more extreme, results when the null hypothesis (H0) of a study question is true – the definition of ‘extreme’ depends on how the hypothesis is being tested. P is also described in terms of rejecting H0 when it is actually true, however, it is not a direct probability of this state.
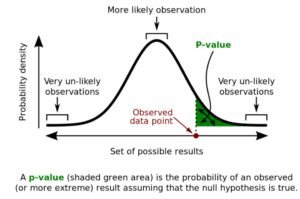
A P-value measures the strength of evidence in support of a null hypothesis. Suppose the test statistic in a hypothesis test is equal to K. The P-value is the probability of observing a test statistic as extreme as K, assuming the null hypothesis is true. If the P-value is less than the significance level, we reject the null hypothesis.
p-Value Method
After formulating the hypothesis, the steps you have to follow to make a decision using the p-value method are as follows:
- Calculate the value of z-score for the sample mean point on the distribution
- Calculate the p-value from the cumulative probability for the given z-score using the z-table
- Make a decision on the basis of the p-value (multiply it by 2 for a two-tailed test) with respect to the given value of α(significance value).
To find the correct p-value from the z-score, first find the cumulative probability by simply looking at the z-table, which gives you the area under the curve till that point.
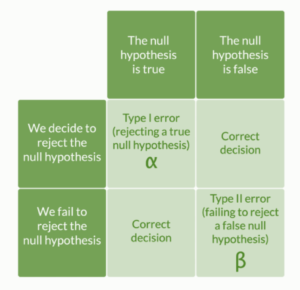
Types of Errors in Hypothesis testing.
There are two possible errors we can commit during hypothesis testing —
- type I error
The type I error occurs when the null hypothesis is true but we reject it, i.e. reject H0 when it is true.
- type II error.
The type II error occurs when the null hypothesis is false but we fail to reject it, i.e. fail to reject H0 when it is false.